

CSF sphingolipids are correlated with neuroinflammatory cytokines and differentiate neuromyelitis optica spectrum disorder from multiple sclerosis


Lisa Shi # 1, Laura Ghezzi # 2,3, Chiara Fenoglio2,3, Anna M. Pietroboni³, Daniela Galimberti2,3, Francesca Pace4,5, Todd A Hardy⁶, Laura Piccio1,4, Anthony S Don¹
¹School of Medical Sciences, Charles Perkins Centre, and Brain and Mind Centre, The University of Sydney, Sydney, New South Wales, 2006, Australia
²Department of Biomedical, Surgical and Dental Sciences, University of Milan, Milan, Italy
³La Fondazione IRCCS Ospedale Maggiore Policlinico, Milano, Italy
⁴Department of Neurology, Washington University in St Louis, St Louis, Missouri, USA
⁵Department of Clinical-Surgical Diagnostic and Pediatric Sciences, University of Pavia, Pavia, Lombardia, Italy
⁶Concord Hospital, Department of Neurology, The University of Sydney, Sydney, New South Wales, Australia
# These authors contributed equally

Introduction
- Multiple sclerosis (MS) is an inflammatory disease of the CNS, characterised by autoimmune-mediated demyelination, neurodegeneration, and progressive loss of neurological function.¹
- Current diagnosis of MS and assessment of cognition relies on magnetic resonance imaging² , which can be expensive, complex and inefficient. It is also difficult to differentiate MS from other neuroinflammatory or demyelinating disorders due to overlapping clinical presentation.³
- NMOSD, characterised by optic neuritis, myelitis and white matter lesions⁴, is similar to MS but uses serum antibodies to the astrocyte water channel, aquaporin 4 (AQP-4), to permit a positive diagnosis.⁵ However, serum antibodies to AQP-4 are absent in 20-40% of NMOSD patients.⁶
- There are currently no reliable molecular biomarkers of MS, prompting the need for diagnostic, prognostic or monitoring biomarkers that can predict clinical outcome and track progression or therapeutic response.⁷
Objectives
Given that myelin is composed of 70-80% lipids (dry weight), this study aimed to identify CSF lipids that:
- Distinguish MS from neuromyelitis optica spectrum disorder (NMOSD), other inflammatory neurological diseases (OIND) and non-inflammatory neurological diseases (NIND).
- Correlate with Expanded Disability Status Scale (EDSS) scores, gadolinium-enhancing (Gd+) lesions, and inflammatory cytokines and chemokines in people with MS.
Methodology
Results
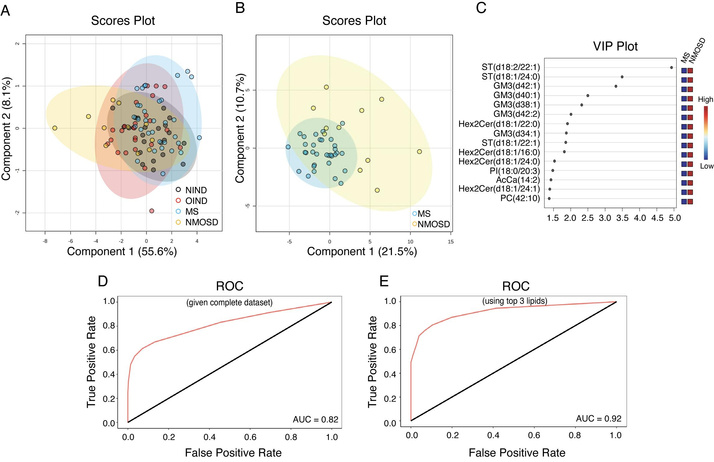

Figure 2. CSF sphingolipids can differentiate NMOSD from MS.
- PLS-DA scores plot for clustering of NIND,
OIND, MS and NMO based on CSF lipids.
(B) PLS-DA and (C) Variable importance in projection plots of MS compared to NMOSD.
(D&E) ROC plots from random forest models for the differentiation of NMOSD from MS using (D) all lipids, or (E) only the top three performing lipids GM3(d42:2), Hex2Cer(d18:1/22:0) and GM3(d38:1).
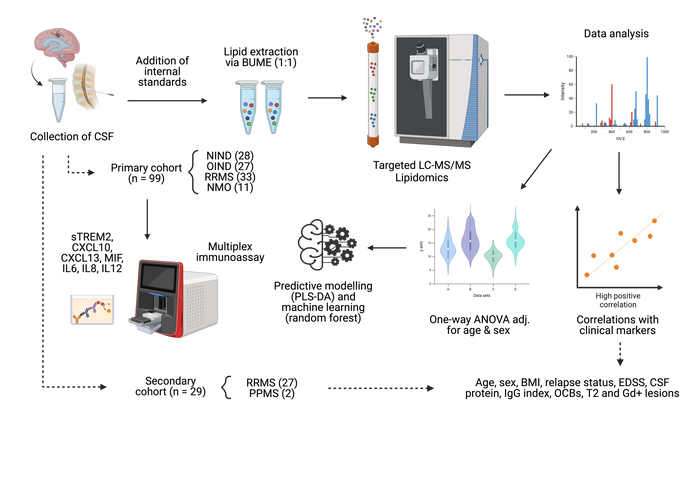
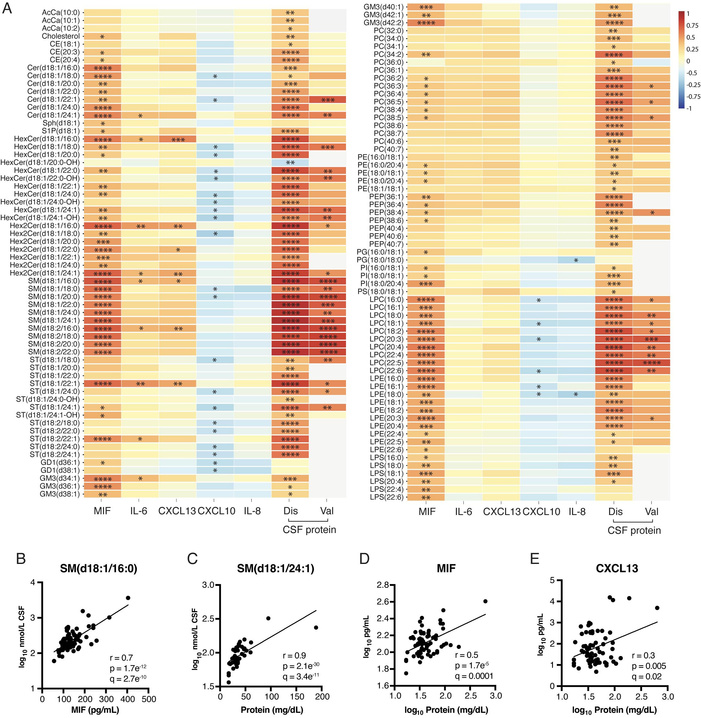
Figure 3. CSF sphingolipids and LPCs are correlated with MIF and total CSF protein.
(A) Correlation heatmap showing the 125 CSF lipids that were significantly correlated with cytokines, chemokines or CSF protein in the discovery (Dis) and validation (Val) cohorts: *q<0.05, **q<0.01, ***q<0.001, ****q<0.0001. Colour scale shows correlation coefficient (r).
Results
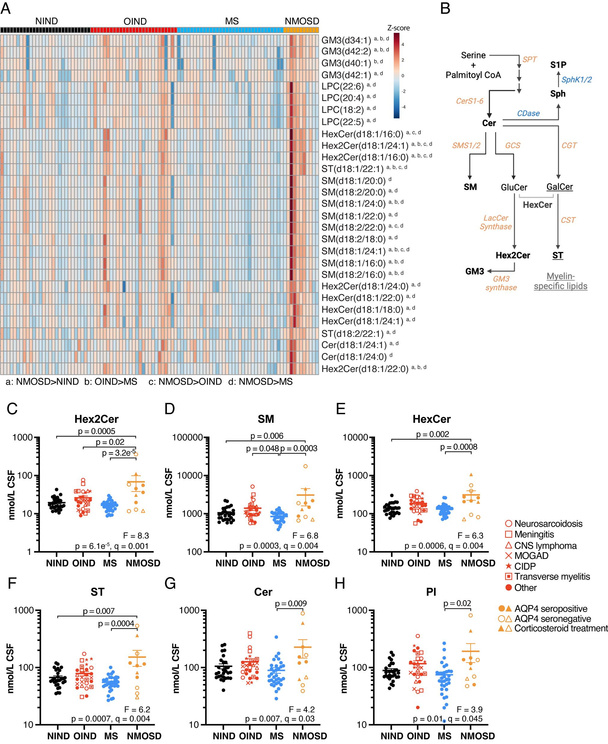
Figure 1. CSF sphingolipid and LPC levels are higher in NMOSD compared to MS.
(A) Heatmap of the 29 lipids differing significantly between NIND, OIND, MS and NMOSD in a one-way ANOVA adjusted for age and sex, and corrected for FDR (q < 0.05). a,b,c,d superscripts denote Tukey’s multiple comparisons.
(B) Biosynthetic pathway illustrating metabolic relationships between the sphingolipids.
(C-H) Lipid class totals whose levels differed significantly between disease groups. Mean ± SEM.

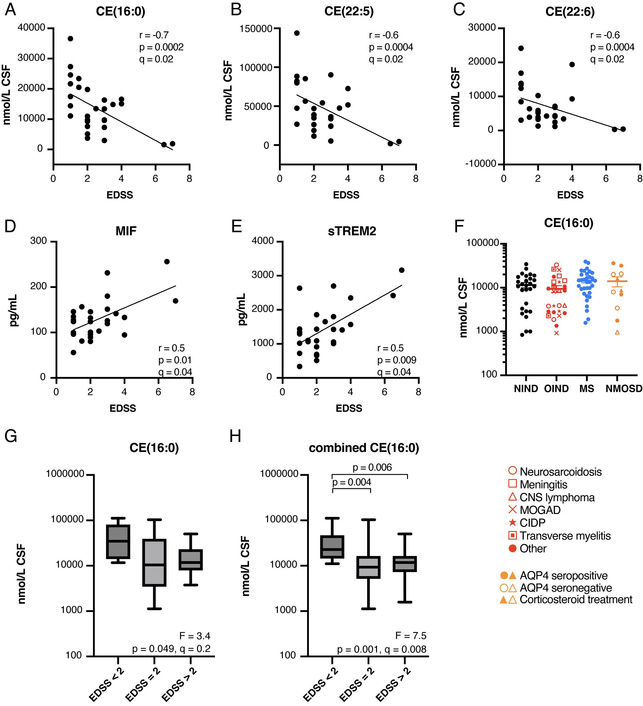
Figure 4. CE(16:0) is inversely correlated with EDSS in two independent cohorts.
Correlations between EDSS score and (A) CE(16:0), (B) CE(22:5), (C) CE(22:6), (D) MIF and (E) sTREM2 in the discovery cohort.
(H) CE(16:0) in MS cases from the combined discovery and validation cohorts, categorised according to EDSS score. Box and whisker represent median, IQR and range.
Conclusion
- CSF sphingolipid levels are elevated in NMOSD compared to MS. Diseases can be differentiated with 91% sensitivity and 91% specificity using GM3(d42:2), Hex2Cer(d18:1/22:0) and GM3(d38:1).
- CSF sphingolipids and LPCs are strongly correlated with MIF, indicating a potential functional interaction in which MIF regulates CSF lipid levels, particularly during demyelination.
- CSF cholesterol ester 16:0 reproducibly declined with increasing EDSS. This may reflect poor clearance of cholesterol released during myelin break-down, and warrants further investigation as a monitoring biomarker of MS disability and therapeutic response.
We would like to gratefully acknowledge subsidised access to the Sydney Mass Spectrometry core facility, Dr Dario Strbenac for assisting with random forest analysis, Dr Anne Cross for heading the neurological diseases sample repository and reading the manuscript, and the study participants who donated CSF.
Acknowledgements:
Scan QR code for links to journal article, digital poster, full references and contact info!
Disclaimer/Funding:
This project was supported by a UPA Scholarship (LS), MS Australia and project grants (TAH, LP, ASD) and a NHMRC grant (ASD). TAH has received honoraria for talks, advisory boards or support for scientific meetings from Bayer-Schering, Biogen Idec, Novartis, Teva, Merck, Alexion, Briston Myers Squibb and Sanofi-Genzyme, and is a paid writer for Australian MS Research Review.